CLIMATE CHANGE
|
Climate change is a significant and lasting change in the statistical distribution of weather patterns over periods ranging from decades to millions of years. It may be a change in average weather conditions, or in the distribution of weather around the average conditions (i.e., more or fewer extreme weather events). Climate change is caused by factors that include oceanic processes (such as oceanic circulation), biotic processes, variations in solar radiation received by Earth, plate tectonics and volcanic eruptions and human-induced alterations of the natural world; these latter effects are currently causing global warming and "climate change" is often used to describe human-specific impacts.
Scientists actively work to understand past and future climate by using observations and theoretical models. Borehole temperature profiles, ice cores, floral and faunal records, glacial and periglacial processes, stable isotope and other sediment analyses, and sea level records serve to provide a climate record that spans the geologic past. |

|
Discussion on Climate Change
Causes of Climate Change
On the broadest scale, the rate at which energy is received from the sun and the rate at which it is lost to space determine the equilibrium temperature and climate of Earth. This energy is distributed around the globe by winds, ocean currents and other mechanisms to affect the climates of different regions.
Factors that can shape climate are called climate forcings or "forcing mechanisms". These include processes such as variations in solar radiation, variations in the Earth's orbit, mountain-building and continental drift and changes in greenhouse gas concentrations. There are a variety of climate change feedbacks that can either amplify or diminish the initial forcing. Some parts of the climate system, such as the oceans and ice caps, respond slowly in reaction to climate forcings, while others respond more quickly. Forcing mechanisms can be either "internal" or "external". Internal forcing mechanisms are natural processes within the climate system itself (e.g., the thermohaline circulation). External forcing mechanisms can be either natural (e.g., changes in solar output) or anthropogenic (e.g., increased emissions of greenhouse gases). Whether the initial forcing mechanism is internal or external, the response of the climate system might be fast (e.g., a sudden cooling due to airborne volcanic ash reflecting sunlight), slow (e.g. thermal expansion of warming ocean water) or a combination (e.g., sudden loss of albedo in the arctic ocean as sea ice melts, followed by more gradual thermal expansion of the water). Therefore, the climate system can respond abruptly but the full response to forcing mechanisms might not be fully developed for centuries or even longer.
Internal forcing mechanisms
Natural changes in the components of Earth's climate system and their interactions are the cause of internal climate variability, or "internal forcings." Scientists generally define the five components of earth's climate system to include atmosphere, hydrosphere, cryosphere, lithosphere (restricted to the surface soils, rocks and sediments) and biosphere.
The ocean is a fundamental part of the climate system, some changes in it occurring at longer timescales than in the atmosphere, massing hundreds of times more and having very high thermal inertia (such as the ocean depths still lagging today in temperature adjustment from the Little Ice Age).
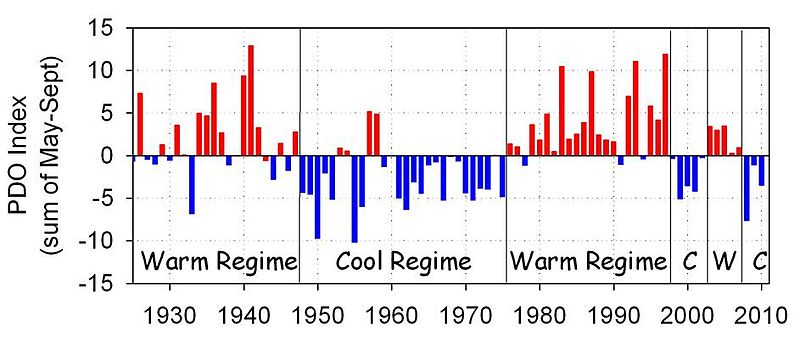
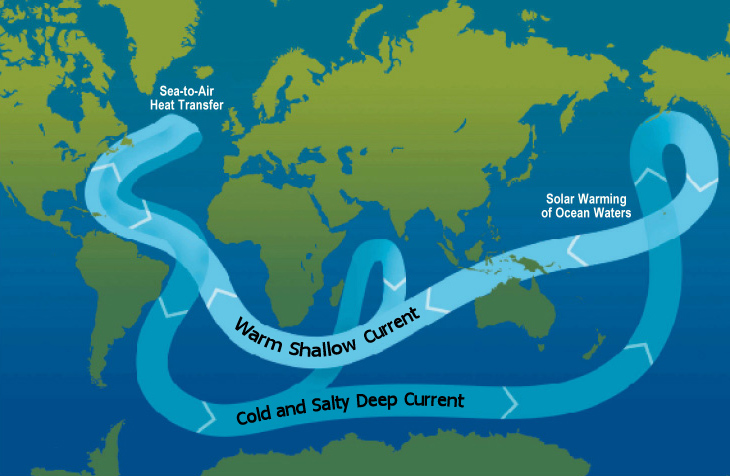
Short-term fluctuations (years to a few decades) such as the El Niño-Southern Oscillation, the Pacific decadal oscillation, the North Atlantic oscillation, and the Arctic oscillation, represent climate variability rather than climate change. On longer time scales, alterations to ocean processes such as thermohaline circulation play a key role in redistributing heat by carrying out a very slow and extremely deep movement of water and the long-term redistribution of heat in the world's oceans.
A schematic of modern thermohaline circulation.
Life
Life affects climate through its role in the carbon and water cycles and such mechanisms as albedo, evapotranspiration, cloud formation, and weathering. Examples of how life may have affected past climate include: glaciation 2.3 billion years ago triggered by the evolution of oxygenic photosynthesis, glaciation 300 million years ago ushered in by long-term burial of decomposition-resistant detritus of vascular land plants (forming coal), termination of the Paleocene-Eocene Thermal Maximum 55 million years ago by flourishing marine phytoplankton, reversal of global warming 49 million years ago by 800,000 years of arctic azolla blooms and global cooling over the past 40 million years driven by the expansion of grass-grazer ecosystems.
Orbital variations
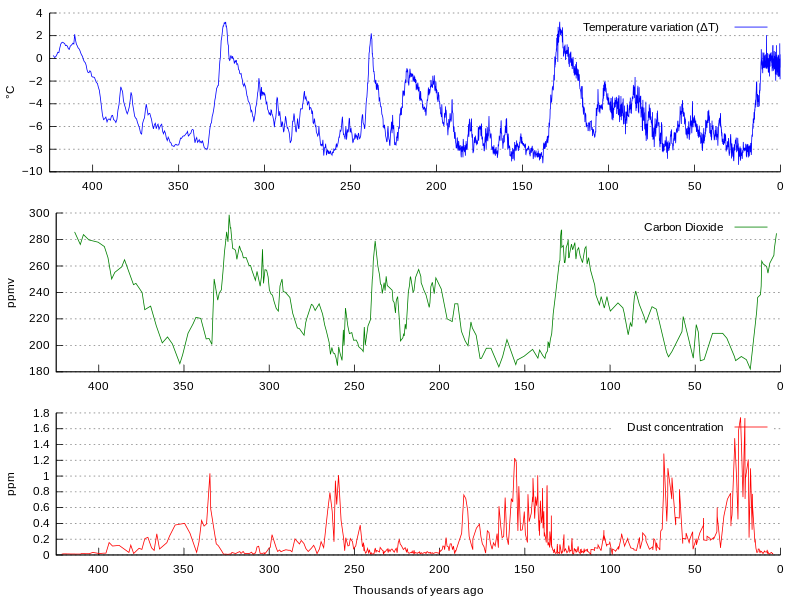
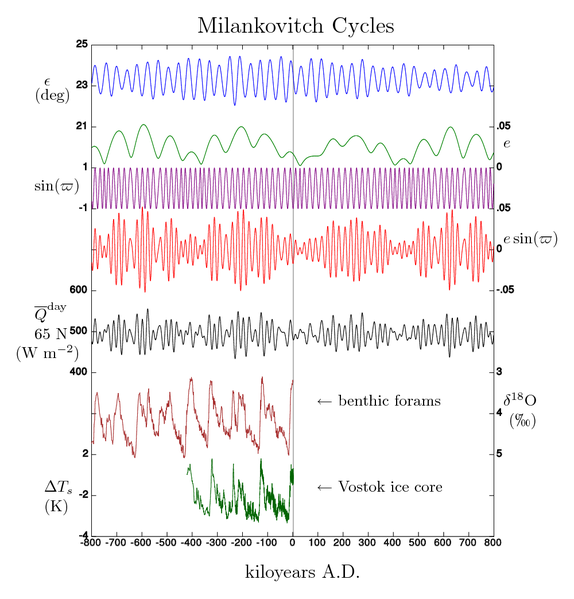
Slight variations in Earth's orbit lead to changes in the seasonal distribution of sunlight reaching the Earth's surface and how it is distributed across the globe. There is very little change to the area-averaged annually averaged sunshine; but there can be strong changes in the geographical and seasonal distribution. The three types of orbital variations are variations in Earth's eccentricity, changes in the tilt angle of Earth's axis of rotation, and precession of Earth's axis. Combined together, these produce Milankovitch cycles which have a large impact on climate and are notable for their correlation to glacial and interglacial periods, their correlation with the advance and retreat of the Sahara and for their appearance in the stratigraphic record.
The IPCC notes that Milankovitch cycles drove the ice age cycles, CO2 followed temperature change "with a lag of some hundreds of years," and that as a feedback amplified temperature change. The depths of the ocean have a lag time in changing temperature (thermal inertia on such scale). Upon seawater temperature change, the solubility of CO2 in the oceans changed, as well as other factors impacting air-sea CO2 exchange.
Solar output
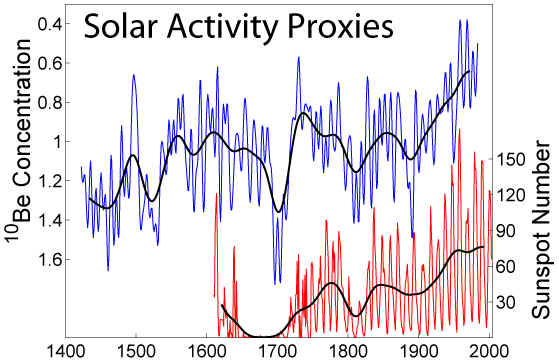
Variations in solar activity during the last several centuries based on observations of sunspots and beryllium isotopes. The period of extraordinarily few sunspots in the late 17th century was the Maunder minimum.
The Sun is the predominant source for energy input to the Earth. Both long- and short-term variations in solar intensity are known to affect global climate.
Magnetic field strength
Some recent (2006+) analysis suggests that global climate is correlated with the strength of Earth's magnetic field.
Volcanism
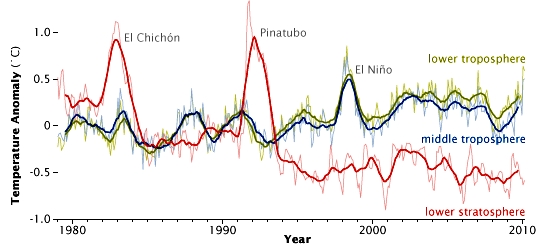
In atmospheric temperature from 1979 to 2010, determined by MSU NASA satellites, effects appear from aerosols released by major volcanic eruptions (El Chichón and Pinatubo). El Niño is a separate event, from ocean variability.
Volcanic eruptions release gases and particulates into the atmosphere. Eruptions large enough to affect climate occur on average several times per century, and cause cooling (by partially blocking the transmission of solar radiation to the Earth's surface) for a period of a few years. The eruption of Mount Pinatubo in 1991, the second largest terrestrial eruption of the 20th century (after the 1912 eruption of Novarupta affected the climate substantially. Global temperatures decreased by about 0.5 °C (0.9 °F). The eruption of Mount Tambora in 1815 caused the Year Without a Summer. Much larger eruptions, known as large igneous provinces, occur only a few times every hundred million years, but may cause global warming and mass extinctions.
Volcanoes are also part of the extended carbon cycle. Over very long (geological) time periods, they release carbon dioxide from the Earth's crust and mantle, counteracting the uptake by sedimentary rocks and other geological carbon dioxide sinks. The US Geological Survey estimates are that volcanic emissions are at a much lower level than the effects of current human activities, which generate 100-300 times the amount of carbon dioxide emitted by volcanoes. A review of published studies indicates that annual volcanic emissions of carbon dioxide, including amounts released from mid-ocean ridges, volcanic arcs, and hot spot volcanoes, are only the equivalent of 3 to 5 days of human caused output. The annual amount put out by human activities may be greater than the amount released bysupererruptions, the most recent of which was the Toba eruption in Indonesia 74,000 years ago.
Although volcanoes are technically part of the lithosphere, which itself is part of the climate system, the IPCC explicitly defines volcanism as an external forcing agent.
Plate tectonics
Over the course of millions of years, the motion of tectonic plates reconfigures global land and ocean areas and generates topography. This can affect both global and local patterns of climate and atmosphere-ocean circulation.
The position of the continents determines the geometry of the oceans and therefore influences patterns of ocean circulation. The locations of the seas are important in controlling the transfer of heat and moisture across the globe, and therefore, in determining global climate. A recent example of tectonic control on ocean circulation is the formation of the Isthmus of Panama about 5 million years ago, which shut off direct mixing between the Atlantic and Pacific Oceans. This strongly affected the ocean dynamics of what is now the Gulf Stream and may have led to Northern Hemisphere ice cove. During the Carboniferous period, about 300 to 360 million years ago, plate tectonics may have triggered large-scale storage of carbon and increased glaciation. Geologic evidence points to a "megamonsoonal" circulation pattern during the time of the supercontinent Pangaea, and climate modeling suggests that the existence of the supercontinent was conducive to the establishment of monsoons.
The size of continents is also important. Because of the stabilizing effect of the oceans on temperature, yearly temperature variations are generally lower in coastal areas than they are inland. A larger supercontinent will therefore have more area in which climate is strongly seasonal than will several smaller continents or islands.
Human influences
In the context of climate variation, anthropogenic factors are human activities which affect the climate. The scientific consensus on climate change is "that climate is changing and that these changes are in large part caused by human activities," and it "is largely irreversible."
“Science has made enormous inroads in understanding climate change and its causes, and is beginning to help develop a strong understanding of current and potential impacts that will affect people today and in coming decades. This understanding is crucial because it allows decision makers to place climate change in the context of other large challenges facing the nation and the world. There are still some uncertainties, and there always will be in understanding a complex system like Earth’s climate. Nevertheless, there is a strong, credible body of evidence, based on multiple lines of research, documenting that climate is changing and that these changes are in large part caused by human activities. While much remains to be learned, the core phenomenon, scientific questions, and hypotheses have been examined thoroughly and have stood firm in the face of serious scientific debate and careful evaluation of alternative explanations.”
Of most concern in these anthropogenic factors is the increase in CO2 levels due to emissions from fossil fuel combustion, followed by aerosols (particulate matter in the atmosphere) and cement manufacture. Other factors, including land use, ozone depletion, animal agriculture[54] and deforestation, are also of concern in the roles they play - both separately and in conjunction with other factors - in affecting climate, microclimate, and measures of climate variables.
Physical evidence for and examples of climatic change
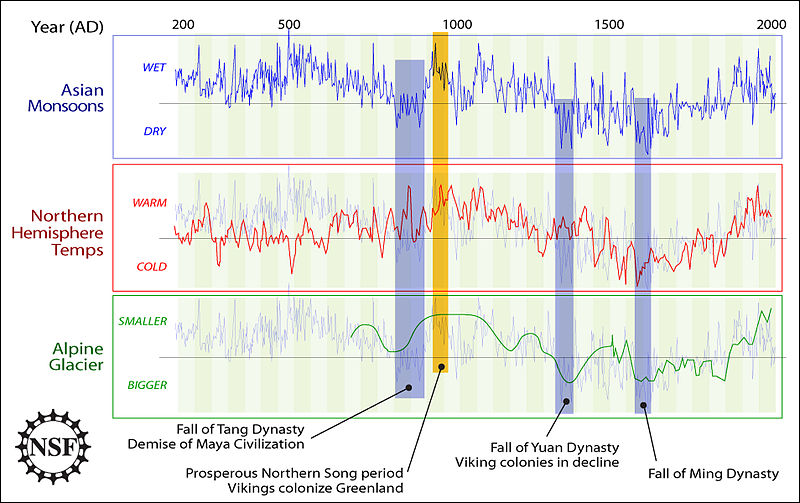
Comparisons between Asian Monsoonsfrom 200 A.D. to 2000 A.D. (staying in the background on other plots), Northern Hemisphere temperature, Alpine glacier extent (vertically inverted as marked), and human history as noted by the U.S. NSF.
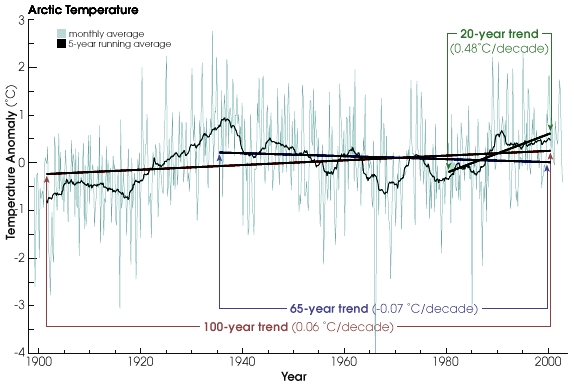
Arctic temperature anomalies over a 100 year period as estimated by NASA. Typical high monthly variance can be seen, while longer-term averages highlight trends.
Evidence for climatic change is taken from a variety of sources that can be used to reconstruct past climates. Reasonably complete global records of surface temperature are available beginning from the mid-late 19th century. For earlier periods, most of the evidence is indirect—climatic changes are inferred from changes in proxies, indicators that reflect climate, such as vegetation, ice cores, dendrochronology, sea level change, andglacial geology.
Temperature measurements and proxies
The instrumental temperature record from surface stations was supplemented by radiosonde balloons, extensive atmospheric monitoring by the mid-20th century, and, from the 1970s on, with global satellite data as well. The 18O/16O ratio in calcite and ice core samplesused to deduce ocean temperature in the distant past is an example of a temperature proxy method, as are other climate metrics noted in subsequent categories.
Historical and archaeological evidence
Climate change in the recent past may be detected by corresponding changes in settlement and agricultural patterns.[56] Archaeological evidence, oral history andhistorical documents can offer insights into past changes in the climate. Climate change effects have been linked to the collapse of various civilizations.
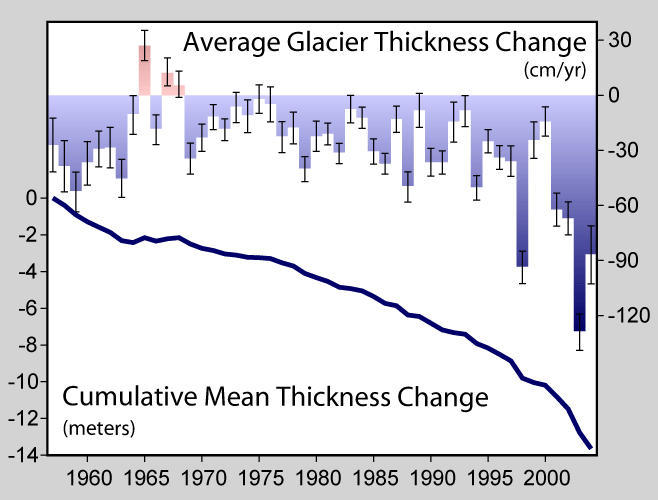
Decline in thickness of glaciers worldwide over the past half-century
Glaciers
Glaciers are considered among the most sensitive indicators of climate change. Their size is determined by a mass balance between snow input and melt output. As temperatures warm, glaciers retreat unless snow precipitation increases to make up for the additional melt; the converse is also true.
Glaciers grow and shrink due both to natural variability and external forcings. Variability in temperature, precipitation, and englacial and subglacial hydrology can strongly determine the evolution of a glacier in a particular season. Therefore, one must average over a decadal or longer time-scale and/or over a many individual glaciers to smooth out the local short-term variability and obtain a glacier history that is related to climate.
This time series, based on satellite data, shows the annual Arctic sea ice minimum since 1979. The September 2010 extent was the third lowest in the satellite record.
Arctic sea ice loss
The decline in Arctic sea ice, both in extent and thickness, over the last several decades is further evidence for rapid climate change. Sea ice is frozen seawater that floats on the ocean surface. It covers millions of square miles in the polar regions, varying with the seasons. In the Arctic, some sea ice remains year after year, whereas almost all Southern Ocean or Antarctic sea ice melts away and reforms annually. Satellite observations show that Arctic sea ice is now declining at a rate of 11.5 percent per decade, relative to the 1979 to 2000 average.
This video summarizes how climate change, associated with increased carbon dioxide levels, has affected plant growth.
Vegetation
A change in the type, distribution and coverage of vegetation may occur given a change in the climate. Some changes in climate may result in increased precipitation and warmth, resulting in improved plant growth and the subsequent sequestration of airborne CO2. A gradual increase in warmth in a region will lead to earlier flowering and fruiting times, driving a change in the timing of life cycles of dependent organisms. Conversely, cold will cause plant bio-cycles to lag. Larger, faster or more radical changes, however, may result in vegetation stress, rapid plant loss and desertification in certain circumstances. An example of this occurred during the Carboniferous Rainforest Collapse (CRC), an extinction event 300 million years ago. At this time vast rainforests covered the equatorial region of Europe and America. Climate change devastated these tropical rainforests, abruptly fragmenting the habitat into isolated 'islands' and causing the extinction of many plant and animal species.
Satellite data available in recent decades indicates that global terrestrial net primary production increased by 6% from 1982 to 1999, with the largest portion of that increase in tropical ecosystems, then decreased by 1% from 2000 to 2009.
Pollen analysis
Palynology is the study of contemporary and fossil palynomorphs, including pollen. Palynology is used to infer the geographical distribution of plant species, which vary under different climate conditions. Different groups of plants have pollen with distinctive shapes and surface textures, and since the outer surface of pollen is composed of a very resilient material, they resist decay. Changes in the type of pollen found in different layers of sediment in lakes, bogs, or river deltas indicate changes in plant communities. These changes are often a sign of a changing climate. As an example, palynological studies have been used to track changing vegetation patterns throughout the Quaternary glaciations and especially since the last glacial maximum.
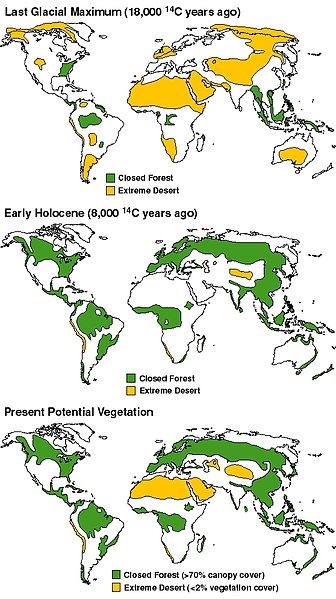
Precipitation
Past precipitation can be estimated in the modern era with the global network of precipitation gauges. Surface coverage over oceans and remote areas is relatively sparse, but, reducing reliance on interpolation, satellite data has been available since the 1970s. Quantification of climatological variation of precipitation in prior centuries and epochs is less complete but approximated using proxies such as marine sediments, ice cores, cave stalagmites, and tree rings.
Climatological temperatures substantially affect precipitation. For instance, during the Last Glacial Maximum of 18,000 years ago, thermal-driven evaporation from the oceans onto continental landmasses was low, causing large areas of extreme desert, including polar deserts (cold but with low rates of precipitation). In contrast, the world's climate was wetter than today near the start of the warmAtlantic Period of 8000 years ago.
Estimated global land precipitation increased by approximately 2% over the course of the 20th century, though the calculated trend varies if different time endpoints are chosen, complicated by ENSO and other oscillations, including greater global land precipitation in the 1950s and 1970s than the later 1980s and 1990s despite the positive trend over the century overall. Similar slight overall increase in global river runoff and in average soil moisture has been perceived.
Dendroclimatology
Dendroclimatology is the analysis of tree ring growth patterns to determine past climate variations. Wide and thick rings indicate a fertile, well-watered growing period, whilst thin, narrow rings indicate a time of lower rainfall and less-than-ideal growing conditions.
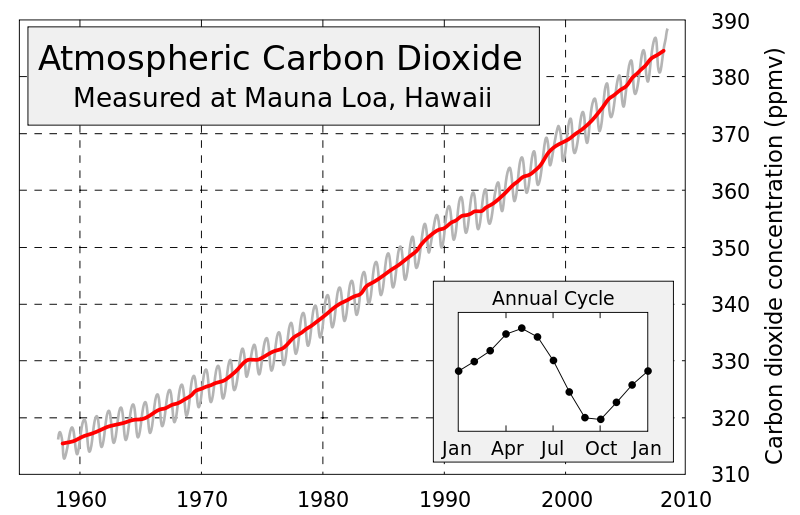
Ice cores
Analysis of ice in a core drilled from an ice sheet such as the Antarctic ice sheet, can be used to show a link between temperature and global sea level variations. The air trapped in bubbles in the ice can also reveal the CO2 variations of the atmosphere from the distant past, well before modern environmental influences. The study of these ice cores has been a significant indicator of the changes in CO2 over many millennia, and continues to provide valuable information about the differences between ancient and modern atmospheric conditions.
Animals
Remains of beetles are common in freshwater and land sediments. Different species of beetles tend to be found under different climatic conditions. Given the extensive lineage of beetles whose genetic makeup has not altered significantly over the millennia, knowledge of the present climatic range of the different species, and the age of the sediments in which remains are found, past climatic conditions may be inferred.
Similarly, the historical abundance of various fish species has been found to have a substantial relationship with observed climatic conditions. Changes in the primary productivity of autotrophs in the oceans can affect marine food webs.
Sea level change
Global sea level change for much of the last century has generally been estimated using tide gauge measurements collated over long periods of time to give a long-term average. More recently, altimeter measurements — in combination with accurately determined satellite orbits — have provided an improved measurement of global sea level change. To measure sea levels prior to instrumental measurements, scientists have dated coral reefs that grow near the surface of the ocean, coastal sediments,marine terraces, ooids in limestones, and nearshore archaeological remains. The predominant dating methods used are uranium series and radiocarbon, with cosmogenic radionuclides being sometimes used to date terraces that have experienced relative sea level fall. In the early Pliocene, global temperatures were 1-2˚C warmer than the present temperature, yet sea level was 15–25 meters higher than today.
On the broadest scale, the rate at which energy is received from the sun and the rate at which it is lost to space determine the equilibrium temperature and climate of Earth. This energy is distributed around the globe by winds, ocean currents and other mechanisms to affect the climates of different regions.
Factors that can shape climate are called climate forcings or "forcing mechanisms". These include processes such as variations in solar radiation, variations in the Earth's orbit, mountain-building and continental drift and changes in greenhouse gas concentrations. There are a variety of climate change feedbacks that can either amplify or diminish the initial forcing. Some parts of the climate system, such as the oceans and ice caps, respond slowly in reaction to climate forcings, while others respond more quickly. Forcing mechanisms can be either "internal" or "external". Internal forcing mechanisms are natural processes within the climate system itself (e.g., the thermohaline circulation). External forcing mechanisms can be either natural (e.g., changes in solar output) or anthropogenic (e.g., increased emissions of greenhouse gases). Whether the initial forcing mechanism is internal or external, the response of the climate system might be fast (e.g., a sudden cooling due to airborne volcanic ash reflecting sunlight), slow (e.g. thermal expansion of warming ocean water) or a combination (e.g., sudden loss of albedo in the arctic ocean as sea ice melts, followed by more gradual thermal expansion of the water). Therefore, the climate system can respond abruptly but the full response to forcing mechanisms might not be fully developed for centuries or even longer.
Internal forcing mechanisms
Natural changes in the components of Earth's climate system and their interactions are the cause of internal climate variability, or "internal forcings." Scientists generally define the five components of earth's climate system to include atmosphere, hydrosphere, cryosphere, lithosphere (restricted to the surface soils, rocks and sediments) and biosphere.
The ocean is a fundamental part of the climate system, some changes in it occurring at longer timescales than in the atmosphere, massing hundreds of times more and having very high thermal inertia (such as the ocean depths still lagging today in temperature adjustment from the Little Ice Age).
Short-term fluctuations (years to a few decades) such as the El Niño-Southern Oscillation, the Pacific decadal oscillation, the North Atlantic oscillation, and the Arctic oscillation, represent climate variability rather than climate change. On longer time scales, alterations to ocean processes such as thermohaline circulation play a key role in redistributing heat by carrying out a very slow and extremely deep movement of water and the long-term redistribution of heat in the world's oceans.
A schematic of modern thermohaline circulation.
Life
Life affects climate through its role in the carbon and water cycles and such mechanisms as albedo, evapotranspiration, cloud formation, and weathering. Examples of how life may have affected past climate include: glaciation 2.3 billion years ago triggered by the evolution of oxygenic photosynthesis, glaciation 300 million years ago ushered in by long-term burial of decomposition-resistant detritus of vascular land plants (forming coal), termination of the Paleocene-Eocene Thermal Maximum 55 million years ago by flourishing marine phytoplankton, reversal of global warming 49 million years ago by 800,000 years of arctic azolla blooms and global cooling over the past 40 million years driven by the expansion of grass-grazer ecosystems.
Orbital variations
Slight variations in Earth's orbit lead to changes in the seasonal distribution of sunlight reaching the Earth's surface and how it is distributed across the globe. There is very little change to the area-averaged annually averaged sunshine; but there can be strong changes in the geographical and seasonal distribution. The three types of orbital variations are variations in Earth's eccentricity, changes in the tilt angle of Earth's axis of rotation, and precession of Earth's axis. Combined together, these produce Milankovitch cycles which have a large impact on climate and are notable for their correlation to glacial and interglacial periods, their correlation with the advance and retreat of the Sahara and for their appearance in the stratigraphic record.
The IPCC notes that Milankovitch cycles drove the ice age cycles, CO2 followed temperature change "with a lag of some hundreds of years," and that as a feedback amplified temperature change. The depths of the ocean have a lag time in changing temperature (thermal inertia on such scale). Upon seawater temperature change, the solubility of CO2 in the oceans changed, as well as other factors impacting air-sea CO2 exchange.
Solar output
Variations in solar activity during the last several centuries based on observations of sunspots and beryllium isotopes. The period of extraordinarily few sunspots in the late 17th century was the Maunder minimum.
The Sun is the predominant source for energy input to the Earth. Both long- and short-term variations in solar intensity are known to affect global climate.
Magnetic field strength
Some recent (2006+) analysis suggests that global climate is correlated with the strength of Earth's magnetic field.
Volcanism
In atmospheric temperature from 1979 to 2010, determined by MSU NASA satellites, effects appear from aerosols released by major volcanic eruptions (El Chichón and Pinatubo). El Niño is a separate event, from ocean variability.
Volcanic eruptions release gases and particulates into the atmosphere. Eruptions large enough to affect climate occur on average several times per century, and cause cooling (by partially blocking the transmission of solar radiation to the Earth's surface) for a period of a few years. The eruption of Mount Pinatubo in 1991, the second largest terrestrial eruption of the 20th century (after the 1912 eruption of Novarupta affected the climate substantially. Global temperatures decreased by about 0.5 °C (0.9 °F). The eruption of Mount Tambora in 1815 caused the Year Without a Summer. Much larger eruptions, known as large igneous provinces, occur only a few times every hundred million years, but may cause global warming and mass extinctions.
Volcanoes are also part of the extended carbon cycle. Over very long (geological) time periods, they release carbon dioxide from the Earth's crust and mantle, counteracting the uptake by sedimentary rocks and other geological carbon dioxide sinks. The US Geological Survey estimates are that volcanic emissions are at a much lower level than the effects of current human activities, which generate 100-300 times the amount of carbon dioxide emitted by volcanoes. A review of published studies indicates that annual volcanic emissions of carbon dioxide, including amounts released from mid-ocean ridges, volcanic arcs, and hot spot volcanoes, are only the equivalent of 3 to 5 days of human caused output. The annual amount put out by human activities may be greater than the amount released bysupererruptions, the most recent of which was the Toba eruption in Indonesia 74,000 years ago.
Although volcanoes are technically part of the lithosphere, which itself is part of the climate system, the IPCC explicitly defines volcanism as an external forcing agent.
Plate tectonics
Over the course of millions of years, the motion of tectonic plates reconfigures global land and ocean areas and generates topography. This can affect both global and local patterns of climate and atmosphere-ocean circulation.
The position of the continents determines the geometry of the oceans and therefore influences patterns of ocean circulation. The locations of the seas are important in controlling the transfer of heat and moisture across the globe, and therefore, in determining global climate. A recent example of tectonic control on ocean circulation is the formation of the Isthmus of Panama about 5 million years ago, which shut off direct mixing between the Atlantic and Pacific Oceans. This strongly affected the ocean dynamics of what is now the Gulf Stream and may have led to Northern Hemisphere ice cove. During the Carboniferous period, about 300 to 360 million years ago, plate tectonics may have triggered large-scale storage of carbon and increased glaciation. Geologic evidence points to a "megamonsoonal" circulation pattern during the time of the supercontinent Pangaea, and climate modeling suggests that the existence of the supercontinent was conducive to the establishment of monsoons.
The size of continents is also important. Because of the stabilizing effect of the oceans on temperature, yearly temperature variations are generally lower in coastal areas than they are inland. A larger supercontinent will therefore have more area in which climate is strongly seasonal than will several smaller continents or islands.
Human influences
In the context of climate variation, anthropogenic factors are human activities which affect the climate. The scientific consensus on climate change is "that climate is changing and that these changes are in large part caused by human activities," and it "is largely irreversible."
“Science has made enormous inroads in understanding climate change and its causes, and is beginning to help develop a strong understanding of current and potential impacts that will affect people today and in coming decades. This understanding is crucial because it allows decision makers to place climate change in the context of other large challenges facing the nation and the world. There are still some uncertainties, and there always will be in understanding a complex system like Earth’s climate. Nevertheless, there is a strong, credible body of evidence, based on multiple lines of research, documenting that climate is changing and that these changes are in large part caused by human activities. While much remains to be learned, the core phenomenon, scientific questions, and hypotheses have been examined thoroughly and have stood firm in the face of serious scientific debate and careful evaluation of alternative explanations.”
Of most concern in these anthropogenic factors is the increase in CO2 levels due to emissions from fossil fuel combustion, followed by aerosols (particulate matter in the atmosphere) and cement manufacture. Other factors, including land use, ozone depletion, animal agriculture[54] and deforestation, are also of concern in the roles they play - both separately and in conjunction with other factors - in affecting climate, microclimate, and measures of climate variables.
Physical evidence for and examples of climatic change
Comparisons between Asian Monsoonsfrom 200 A.D. to 2000 A.D. (staying in the background on other plots), Northern Hemisphere temperature, Alpine glacier extent (vertically inverted as marked), and human history as noted by the U.S. NSF.
Arctic temperature anomalies over a 100 year period as estimated by NASA. Typical high monthly variance can be seen, while longer-term averages highlight trends.
Evidence for climatic change is taken from a variety of sources that can be used to reconstruct past climates. Reasonably complete global records of surface temperature are available beginning from the mid-late 19th century. For earlier periods, most of the evidence is indirect—climatic changes are inferred from changes in proxies, indicators that reflect climate, such as vegetation, ice cores, dendrochronology, sea level change, andglacial geology.
Temperature measurements and proxies
The instrumental temperature record from surface stations was supplemented by radiosonde balloons, extensive atmospheric monitoring by the mid-20th century, and, from the 1970s on, with global satellite data as well. The 18O/16O ratio in calcite and ice core samplesused to deduce ocean temperature in the distant past is an example of a temperature proxy method, as are other climate metrics noted in subsequent categories.
Historical and archaeological evidence
Climate change in the recent past may be detected by corresponding changes in settlement and agricultural patterns.[56] Archaeological evidence, oral history andhistorical documents can offer insights into past changes in the climate. Climate change effects have been linked to the collapse of various civilizations.
Decline in thickness of glaciers worldwide over the past half-century
Glaciers
Glaciers are considered among the most sensitive indicators of climate change. Their size is determined by a mass balance between snow input and melt output. As temperatures warm, glaciers retreat unless snow precipitation increases to make up for the additional melt; the converse is also true.
Glaciers grow and shrink due both to natural variability and external forcings. Variability in temperature, precipitation, and englacial and subglacial hydrology can strongly determine the evolution of a glacier in a particular season. Therefore, one must average over a decadal or longer time-scale and/or over a many individual glaciers to smooth out the local short-term variability and obtain a glacier history that is related to climate.
This time series, based on satellite data, shows the annual Arctic sea ice minimum since 1979. The September 2010 extent was the third lowest in the satellite record.
Arctic sea ice loss
The decline in Arctic sea ice, both in extent and thickness, over the last several decades is further evidence for rapid climate change. Sea ice is frozen seawater that floats on the ocean surface. It covers millions of square miles in the polar regions, varying with the seasons. In the Arctic, some sea ice remains year after year, whereas almost all Southern Ocean or Antarctic sea ice melts away and reforms annually. Satellite observations show that Arctic sea ice is now declining at a rate of 11.5 percent per decade, relative to the 1979 to 2000 average.
This video summarizes how climate change, associated with increased carbon dioxide levels, has affected plant growth.
Vegetation
A change in the type, distribution and coverage of vegetation may occur given a change in the climate. Some changes in climate may result in increased precipitation and warmth, resulting in improved plant growth and the subsequent sequestration of airborne CO2. A gradual increase in warmth in a region will lead to earlier flowering and fruiting times, driving a change in the timing of life cycles of dependent organisms. Conversely, cold will cause plant bio-cycles to lag. Larger, faster or more radical changes, however, may result in vegetation stress, rapid plant loss and desertification in certain circumstances. An example of this occurred during the Carboniferous Rainforest Collapse (CRC), an extinction event 300 million years ago. At this time vast rainforests covered the equatorial region of Europe and America. Climate change devastated these tropical rainforests, abruptly fragmenting the habitat into isolated 'islands' and causing the extinction of many plant and animal species.
Satellite data available in recent decades indicates that global terrestrial net primary production increased by 6% from 1982 to 1999, with the largest portion of that increase in tropical ecosystems, then decreased by 1% from 2000 to 2009.
Pollen analysis
Palynology is the study of contemporary and fossil palynomorphs, including pollen. Palynology is used to infer the geographical distribution of plant species, which vary under different climate conditions. Different groups of plants have pollen with distinctive shapes and surface textures, and since the outer surface of pollen is composed of a very resilient material, they resist decay. Changes in the type of pollen found in different layers of sediment in lakes, bogs, or river deltas indicate changes in plant communities. These changes are often a sign of a changing climate. As an example, palynological studies have been used to track changing vegetation patterns throughout the Quaternary glaciations and especially since the last glacial maximum.
Precipitation
Past precipitation can be estimated in the modern era with the global network of precipitation gauges. Surface coverage over oceans and remote areas is relatively sparse, but, reducing reliance on interpolation, satellite data has been available since the 1970s. Quantification of climatological variation of precipitation in prior centuries and epochs is less complete but approximated using proxies such as marine sediments, ice cores, cave stalagmites, and tree rings.
Climatological temperatures substantially affect precipitation. For instance, during the Last Glacial Maximum of 18,000 years ago, thermal-driven evaporation from the oceans onto continental landmasses was low, causing large areas of extreme desert, including polar deserts (cold but with low rates of precipitation). In contrast, the world's climate was wetter than today near the start of the warmAtlantic Period of 8000 years ago.
Estimated global land precipitation increased by approximately 2% over the course of the 20th century, though the calculated trend varies if different time endpoints are chosen, complicated by ENSO and other oscillations, including greater global land precipitation in the 1950s and 1970s than the later 1980s and 1990s despite the positive trend over the century overall. Similar slight overall increase in global river runoff and in average soil moisture has been perceived.
Dendroclimatology
Dendroclimatology is the analysis of tree ring growth patterns to determine past climate variations. Wide and thick rings indicate a fertile, well-watered growing period, whilst thin, narrow rings indicate a time of lower rainfall and less-than-ideal growing conditions.
Ice cores
Analysis of ice in a core drilled from an ice sheet such as the Antarctic ice sheet, can be used to show a link between temperature and global sea level variations. The air trapped in bubbles in the ice can also reveal the CO2 variations of the atmosphere from the distant past, well before modern environmental influences. The study of these ice cores has been a significant indicator of the changes in CO2 over many millennia, and continues to provide valuable information about the differences between ancient and modern atmospheric conditions.
Animals
Remains of beetles are common in freshwater and land sediments. Different species of beetles tend to be found under different climatic conditions. Given the extensive lineage of beetles whose genetic makeup has not altered significantly over the millennia, knowledge of the present climatic range of the different species, and the age of the sediments in which remains are found, past climatic conditions may be inferred.
Similarly, the historical abundance of various fish species has been found to have a substantial relationship with observed climatic conditions. Changes in the primary productivity of autotrophs in the oceans can affect marine food webs.
Sea level change
Global sea level change for much of the last century has generally been estimated using tide gauge measurements collated over long periods of time to give a long-term average. More recently, altimeter measurements — in combination with accurately determined satellite orbits — have provided an improved measurement of global sea level change. To measure sea levels prior to instrumental measurements, scientists have dated coral reefs that grow near the surface of the ocean, coastal sediments,marine terraces, ooids in limestones, and nearshore archaeological remains. The predominant dating methods used are uranium series and radiocarbon, with cosmogenic radionuclides being sometimes used to date terraces that have experienced relative sea level fall. In the early Pliocene, global temperatures were 1-2˚C warmer than the present temperature, yet sea level was 15–25 meters higher than today.
NOTE: Texts and Pictures adapted from - http://en.wikipedia.org/wiki/Climate_change

Climate Change Analysis in Pictures
© BiNET 2008-2014 | Terms of use, privacy and disclaimer | Help us to improve
